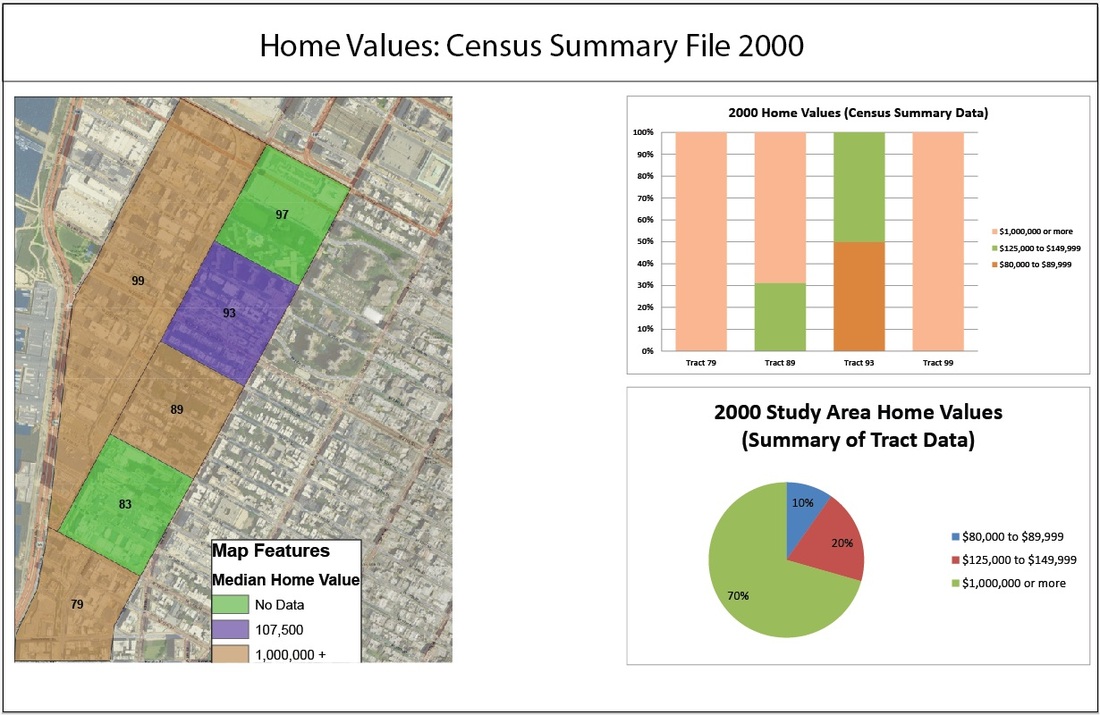
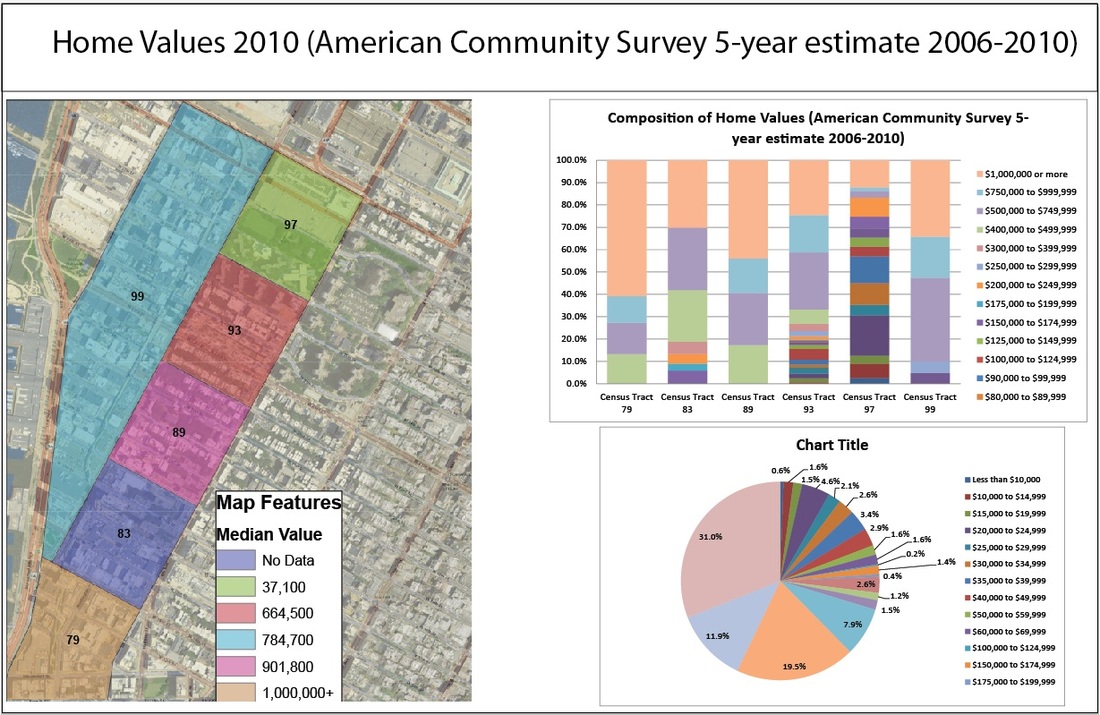
Home Value Comparisons
With the recent collapse of the housing bubble in 2008, home values unfortunately may not be the best indicator of post High Line gentrification. In addition, data were compiled from the American Community 5-year survey (2006-2010) and the 2000 Census Summary File, so this may present a data quality concern for comparability. Insofar as it can be ascertained, the data suggest that home values have appreciated in census tract 93. At the same time, however, the maps show depreciating home values in tract 99. The column graphs actually suggest that home values have become more diverse within recent years. From this data alone, one cannot reasonably conclude that significant gentrification occurred as a result of the High Line construction.
Cover photo by Laurel Hanson
