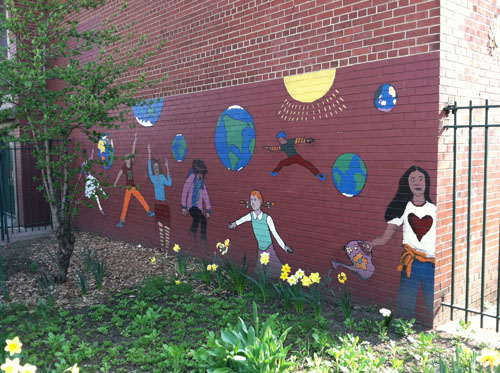
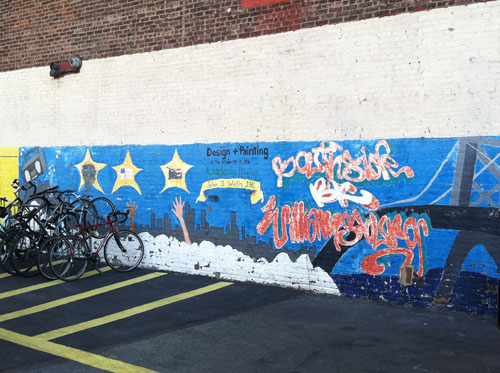
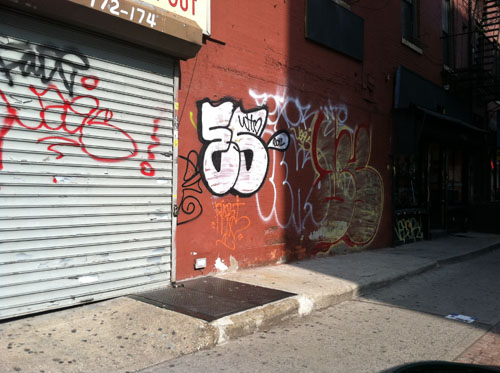
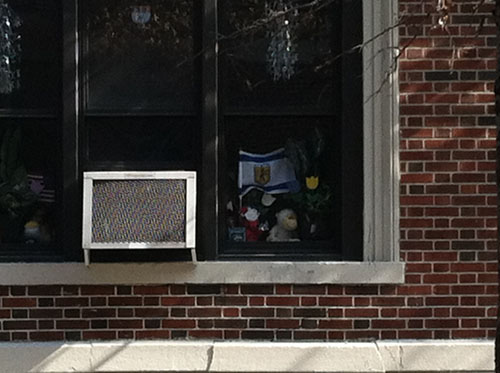
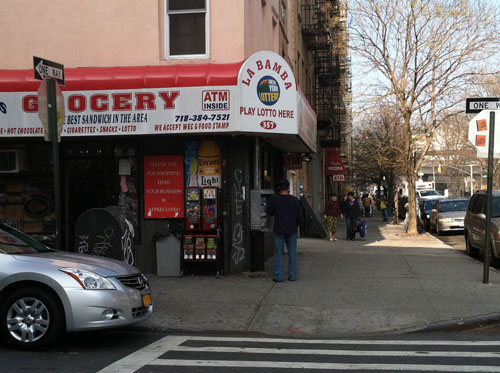
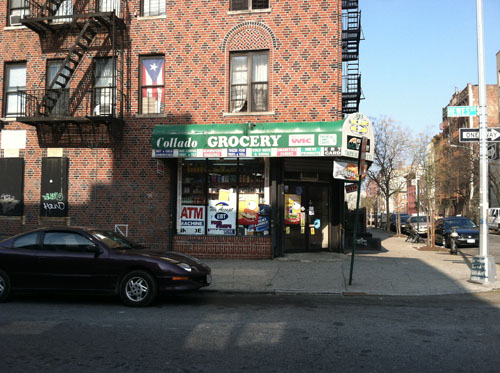
S. Third Ave.S Third Ave housed the highest percentages of Graffiti and Local/Cultural artwork. In contrast, S Third Ave. had the lowest percentage of Artistic/Nice Graffiti pieces and no artwork designated as Commercial or Political/Religious Statements. This demonstrates a priority to local artistic expression often linking to the nationality and culture of the neighborhood as seen in Photo 1. Photo 1 is a mural with a scenic view highlighting a Puerto Rican flag, open water, and palm trees. Photo 2 directly represents the Williamsburg area with the Williamsburg bridge to the right and the Manhattan Skyline across the water. This imagery shows local pride in the neighborhood Many of the Local/Cultural pieces were murals in connection with public schools. The individuals in the Photo 3 mural are highly diversified. Third Ave. demonstrates a significant amount of Graffiti in the neighborhood as seen in Photos 4.
Trend |
|
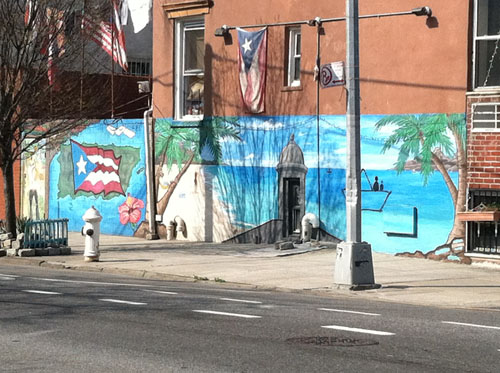
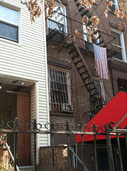
Another trend is reflected in the frequency of Local/Cultural artwork. The southern-most portion of the study area, S Third Ave., has the most Local/Cultural pieces with 44.74 percent of the total. This category of artwork decreases northbound: 27.27 percent on Metropolitan Ave. to 18.18 percent on N Eighth Ave. The themes present in Local/Cultural artwork reflect pride in the neighborhood, recognizing nationalities, and celebrating diversity. Photo 1 is one example of national pride. This photo is unique because while the mural highlights the Puerto Rican flag, an American and Puerto Rican flag are hung above. This shows the embracement of multiple identities and coinciding identities. Photos 5-8 also show cultural identity features.
|
|
|
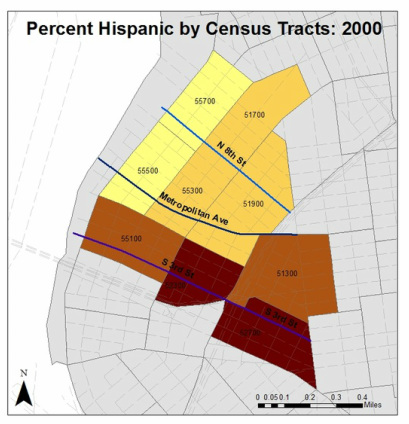
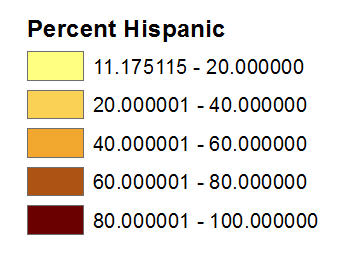
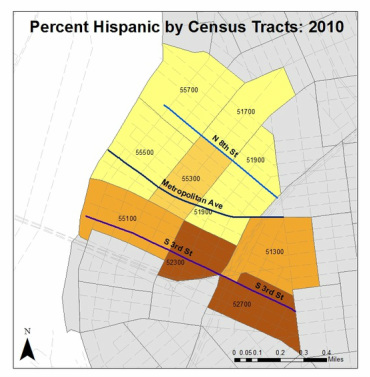
This trend towards nationalism and culturalism can be tied to the demographics of the residing populations. The Tables below show the demographic distribution of race, multiple races, and Hispanic identity by census tracts of each study street. The most apparent representative group of people that are also reflected in the census data, artwork and noted flags is the Hispanic population. The maps below demonstrate the decline in Hispanic population through the study area from 2000 to 2010. As a sign of gentrification, the hispanic population is displaced and is now most concentrated around S Third Ave. Hispanic populations are being replaced by increasing percentages of white populations (See increases in White population in census data from 2000 to 2010). This distribution of populations reflect the old standard of gentrification with popultion displacement.
|
Smith’s theory that the most recent form of gentrification relies on creating new environments and is, therefore, reflected the displacement of Local/Cultural artwork of former residents. S Third Ave. has retained its cultural identity of its residing populations the best even with pressing gentrification.
The New York Daily’s News article written by Nelson and Morales recognizes the cultural aspects of the southside of the Williamsburg neighbhorhood and discusses how Latino residents are trying to take back their community (2012). The Green Light District project discussed, aims to raise the quality of life of current residents on the Southside so they can thrive in the area and promote there hertiage. Projects such as this coincide with Local/Cultural artwork trends in this neighbhorhood. |
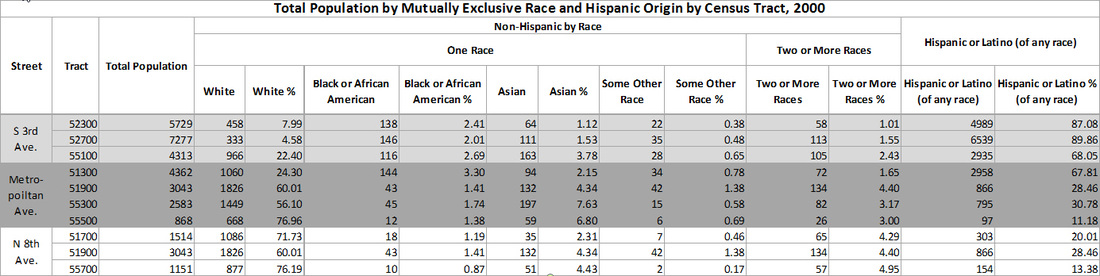
2000 Census Demographic Data
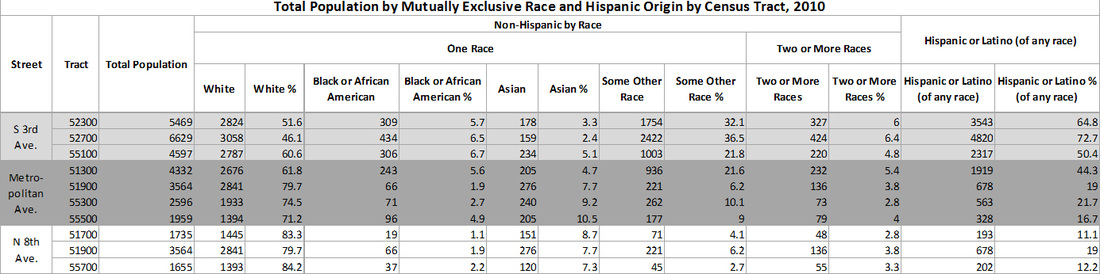
2010 Census Demographic Data
|
|
Nelson, Kate, and Mark Morales. "Brooklyn Gentrification Meets Resistance from Longtime Latino Residents in South Williamsburg." New York Daily News [New York City] 16 Sept. 2011.
US Census Bureau: Census Tracts and Demographic data from 2000 and 2010 http://factfinder2.census.gov/faces/nav/jsf/pages/index.xhtml
Photos collected by Meghan Kelly
US Census Bureau: Census Tracts and Demographic data from 2000 and 2010 http://factfinder2.census.gov/faces/nav/jsf/pages/index.xhtml
Photos collected by Meghan Kelly
